Deliverables
1) Addressing the missing information to create a proper user journey and first models
2) “Off-the-shelf” solution proposal for data visualization
3) Hypothetical user journey
4) A mock-up of an artificial intelligence tool, that validates the containers identified by the algorithm as most likely to have medical supplies.
Role
Senior UX|UI Designer
Tools Used
Figma, Canva
The following assignment depicts the process of designing an AI-based tool to identify shipping containers that are most likely to carry medical supplies in order to prioritize their delivery to the population and potentially help to save more lives.
ASSIGNMENT BREAKDOWN
Assignment Background and Evalutation
1.Missing Information
2. Off-The-Shelf Solutions
3. User Journey
4. Mockups
ASSIGNMENT BACKGROUND
AND EVALUATION
Project Scope
A new virus is spreading around the world. It is hitting China and Italy with full force and is continuing its relentless progression.
The lockdowns are abundant and occur at any time in different regions of the world. The whole supply chain is affected, and the entire world is throwing itself on toilet paper… why toilet paper more than anything else, nobody understands! In this context, ports all over the world are overwhelmed, and all their yards are chaotic.
One of these ports approaches you and asks for your help in prioritizing the medical supplies arriving by ship.
They explain that the shortage of truckers is hitting them hard, and they need to encourage these carriers to pick up these valuable containers so that the medical contents can help save lives.
Here are the main objectives they mention to you:
- They want to, through an artificial intelligence tool, validate the containers identified by the algorithm as most likely to have medical supplies. This tool is, therefore, a decision aid;
- They want to emphasize to shipping companies the importance of these containers.
What is the goal?
To design an intuitive web application where users can identify and prioritize shipping containers with medical supplies, as well as to emphasize the importance of these containers to shipping companies.
Who is the audience?
- People in charge of the decision-making behind prioritizing shipping containers at the port
- Shipping and carrier companies
- Truck drivers and delivery personnel
Research
Dongping Song. 2021. Container Shipping Supply Chain. Scholarly Community Encyclopedia.
What does success looks like?
- Stakeholders can use our tool to easily and effectively identify and prioritize shipping containers with medical supplies.
- Shipping companies prioritize these containers and deliver them on time.
- The supply chain process is optimized thanks to our tool significantly.
- More lives are saved due to optimizations in the supply chain.
PART 1:
MISSING INFORMATION
What information are you missing in order to start describing the user journey and drawing the first models?

Insight into our potential target audience. A.k.a the decision makers that decide which container is going where

Insight into the day-to-day operations at the port, specifically when it comes to selecting and assigning shipping containers.

Insight into the relationship between the port and the carrier companies.

Insight into existing technologies and processes that the port is already using to select and prioritize shipping containers.

Insight into the stakeholders’ current paint points, hopes, and expectations.
PART 2:
OFF-THE-SHELF SOLUTIONS
What “Off The Shelf” tools would you use to quickly output a visualization of the data (both incoming and outgoing from the algorithm)?

Tableau
“The market-leading choice for modern business intelligence, the Tableau platform is known for taking any kind of data from almost any system and turning it into actionable insights with speed and ease. It’s as simple as dragging and dropping.”

Infogram
“Infogram is an intuitive visualization tool that empowers people and teams to create beautiful content.”

Datawrapper
“Datawrapper lets you show your data as beautiful charts, maps or tables with a few clicks. Find out more about all the available visualization types.”
PART 3:
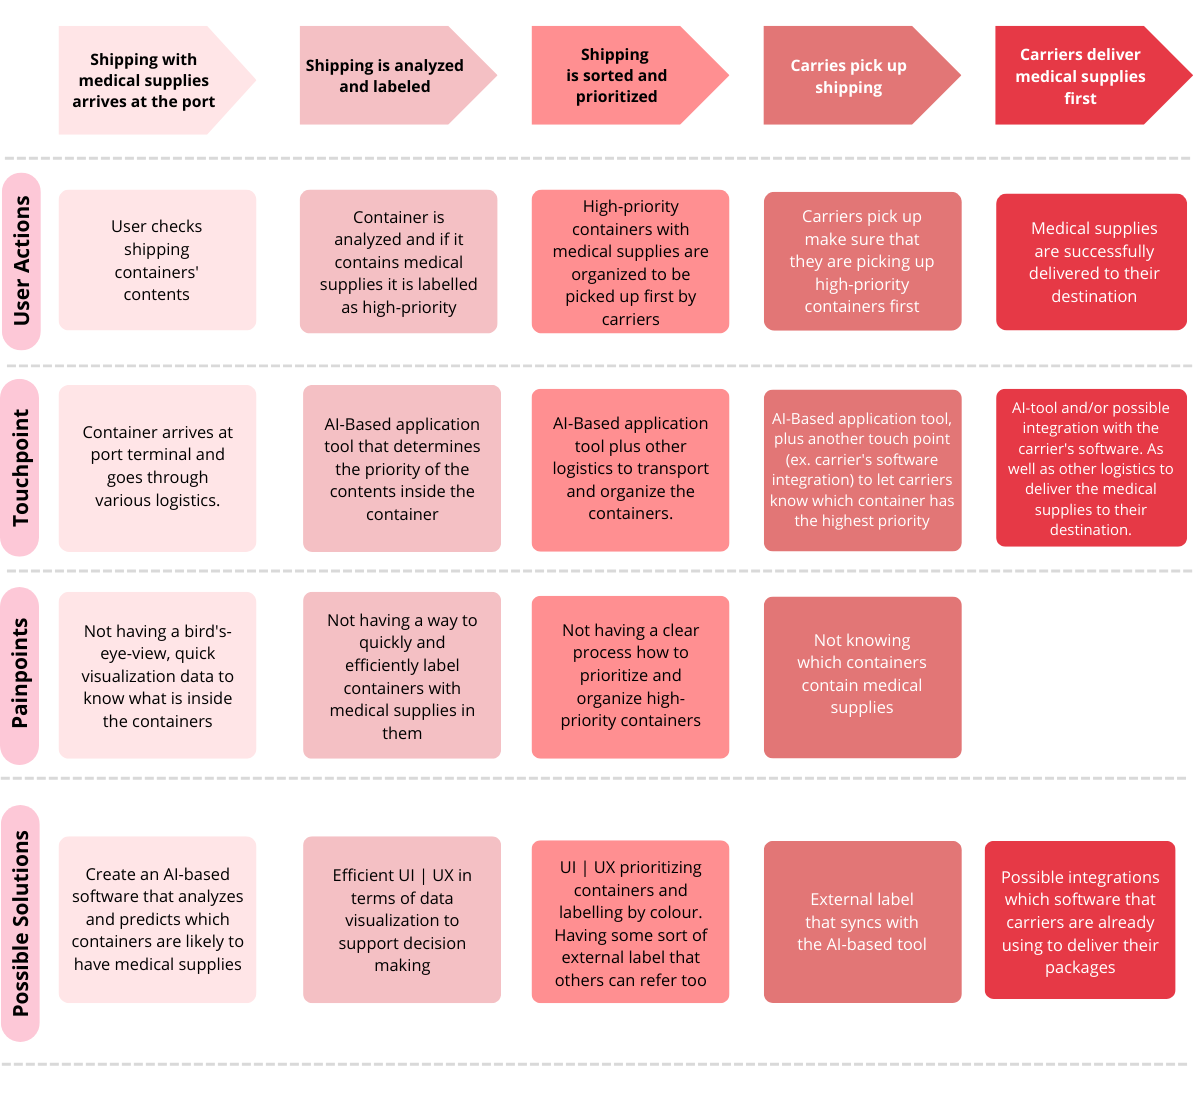
CUSTOMER JOURNEY
How would you illustrate the user journey?
PART 4:
HIGH FIDELITY PROTOTYPE
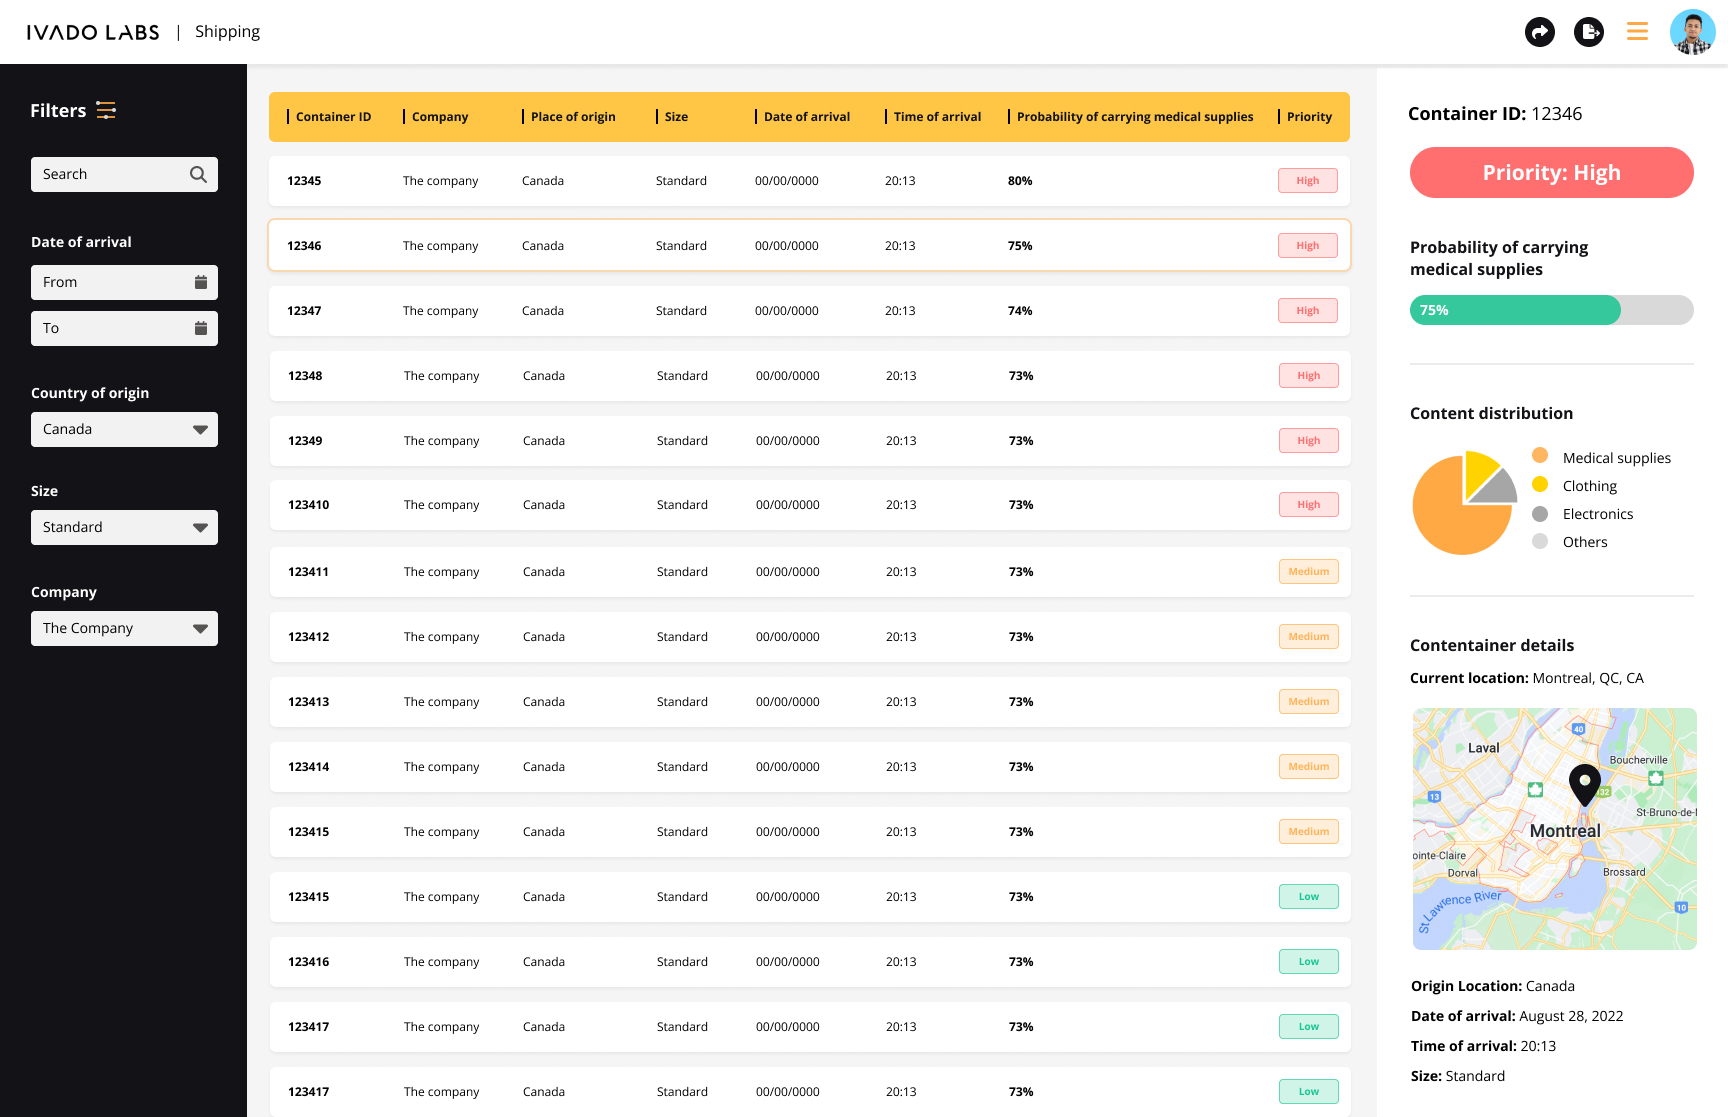
A simple and intuitive interface that gives the right information right away.
Based on the assignment’s goal, I designed a clean, easy-to-read interface where the most important data was also the most prominent. In this case, whether or not a shipping container had medical supplies.
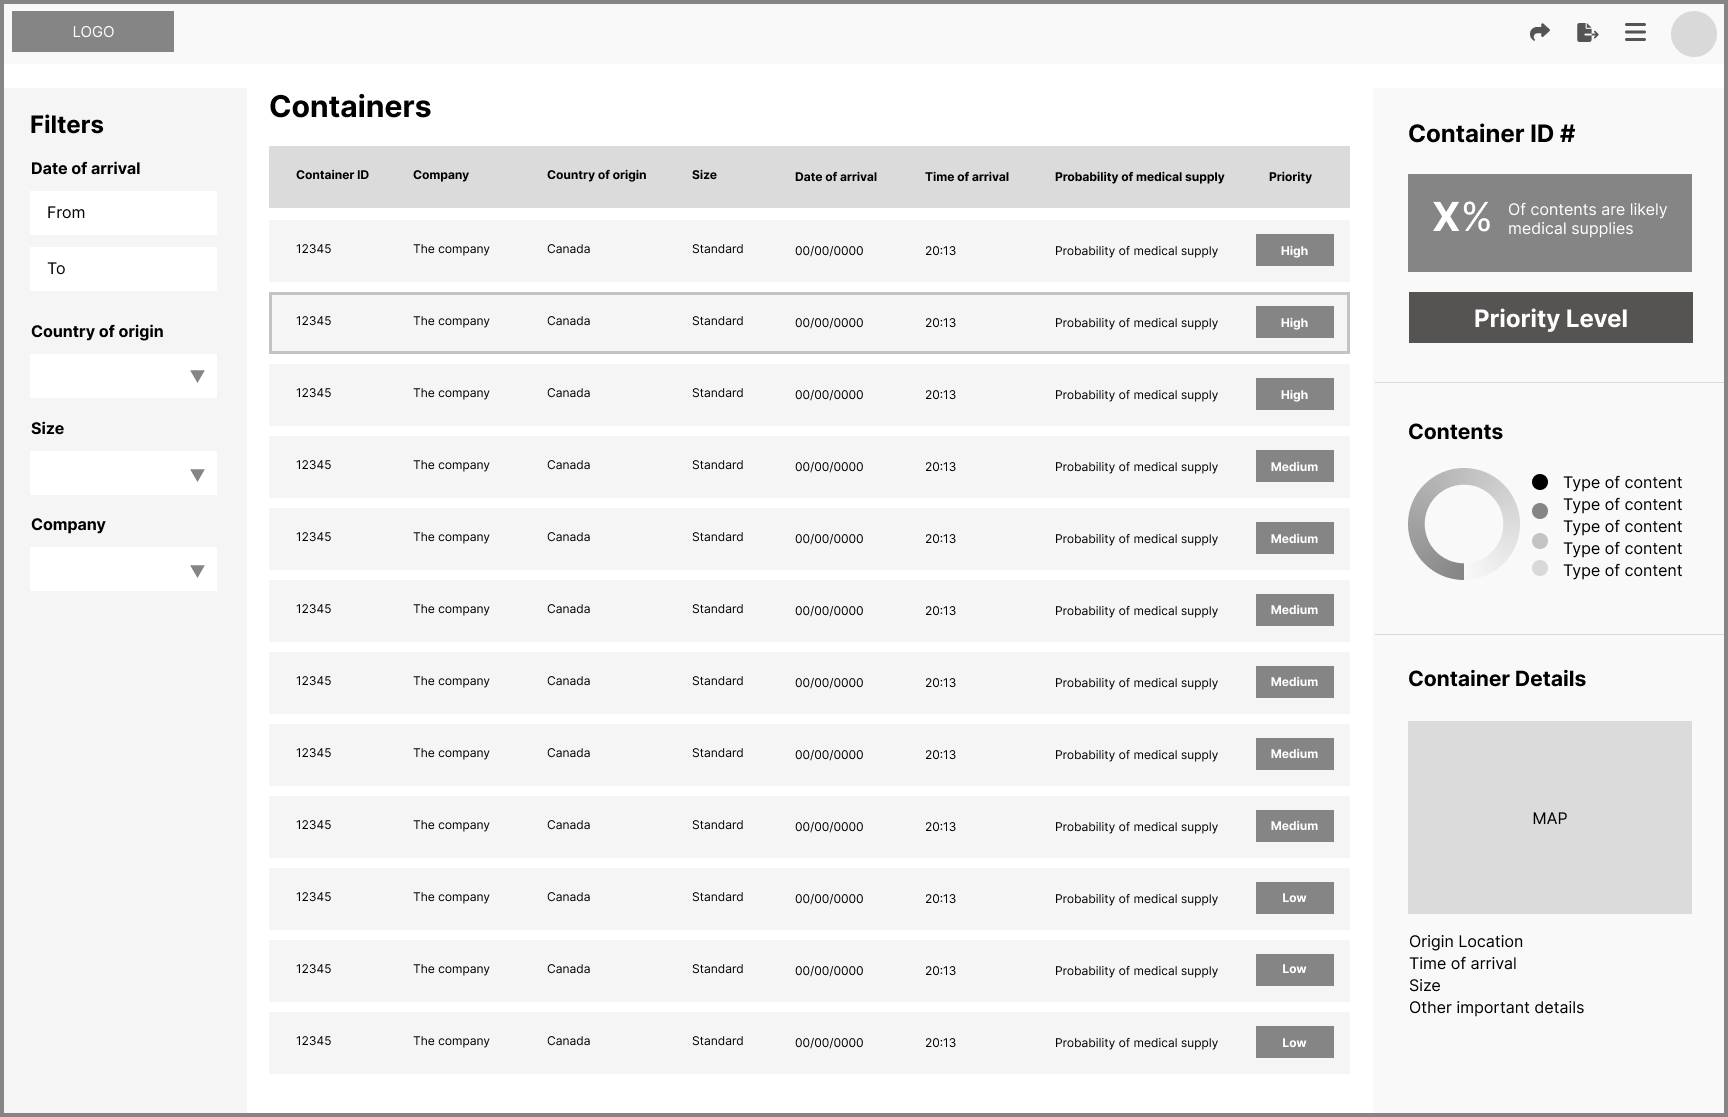
Wireframe
Wireframes serve as a low-fidelity iteration to help discern the layout and functionality of the design. They are also helpful in sharing the design vision with the project’s stakeholders.
FINAL THOUGHTS
This assignment was an exciting and complex undertaking. Due to the fact that there was a lot of information missing, the design executed in this activity is, more or less, a hypothesis.
If I were to do this project in a real-life scenario, I would make sure to do more research, interview members of our target
audience (if possible), create more accurate customer journeys and personas, and collaborate with the different teams involved in the project. All with the goal of making sure to design the best product possible for the client.